
6 BEST FOREX INDICATORS
Explore the 6 best forex indicators to boost your trading strategy. Uncover how these powerful tools can help you analyze trends, identify opportunities, and make smarter trading decisions
TICKINSIGHT
Tickmill
3/2/20253 min read

6 Best Forex Technical Indicators
In the world of forex trading, technical indicators are tools used to analyze price movements and help traders make better decisions. Here are six of the best forex technical indicators commonly used by professional traders.
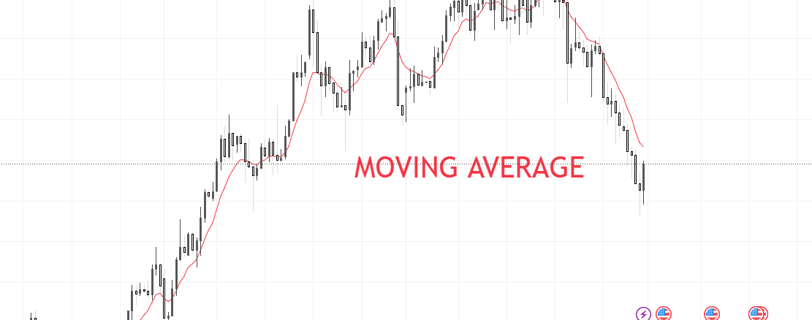
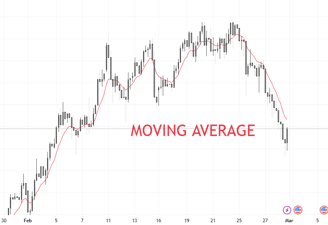
1. Moving Average (MA)
Moving Average (MA) is an indicator used to smooth price movements and identify market trends. There are two main types of MA:
Simple Moving Average (SMA): Calculates the average price over a specific period.
Exponential Moving Average (EMA):** Focuses more on recent prices, making it more responsive to market changes.
MAs are often used in combination to identify “golden cross” and “death cross” signals, which indicate major trend changes.
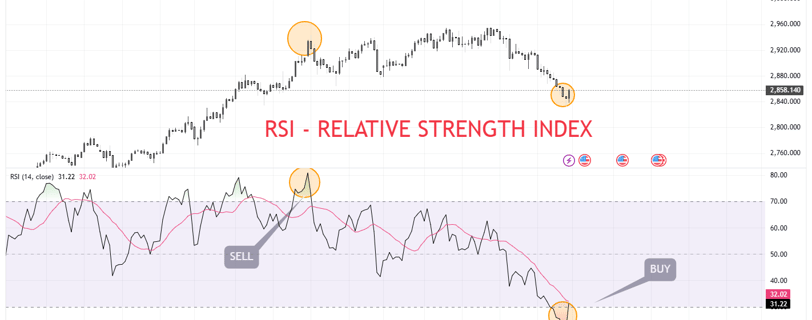
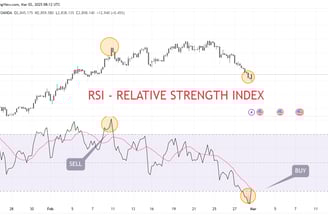
2. Relative Strength Index (RSI)
RSI is a momentum indicator that measures the speed and change of price movements. RSI ranges from 0 to 100, with the following interpretations:
Above 70: The market is considered overbought, potentially leading to a price correction.
Below 30: The market is considered oversold, potentially leading to a price rebound.
RSI is very useful for identifying divergence, where price and RSI move in opposite directions, often signaling a trend reversal.
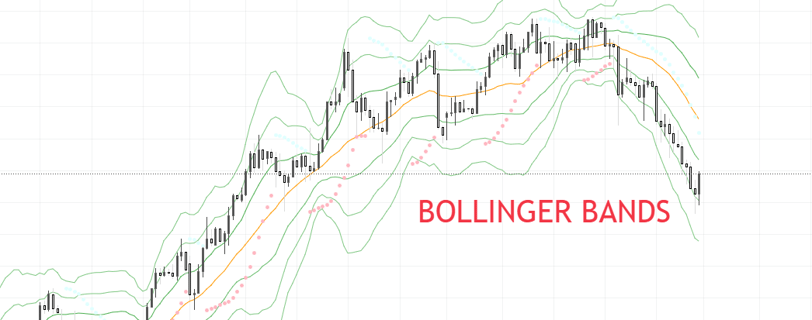
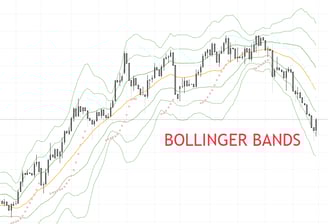
3. Bollinger Bands
Bollinger Bands consist of three lines:
- Middle Band: SMA (typically 20-period).
- Upper Band: Middle Band + 2 standard deviations.
- Lower Band: Middle Band - 2 standard deviations.
Bollinger Bands help identify market volatility and potential breakout points. If the price touches the upper band, the market is considered overbought, and if it touches the lower band, the market is considered oversold.
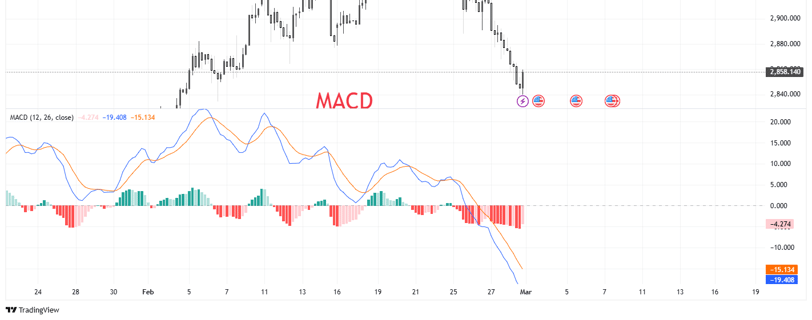
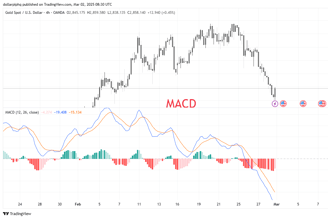
4. MACD (Moving Average Convergence Divergence)
MACD is a trend and momentum indicator consisting of three components:
MACD Line: The difference between the 12-period EMA and the 26-period EMA.
Signal Line: 9-period EMA of the MACD Line.
Histogram: A visual representation of the difference between the MACD Line and the Signal Line.
A buy signal occurs when the MACD Line crosses the Signal Line from below, while a sell signal occurs when the MACD Line crosses the Signal Line from above.
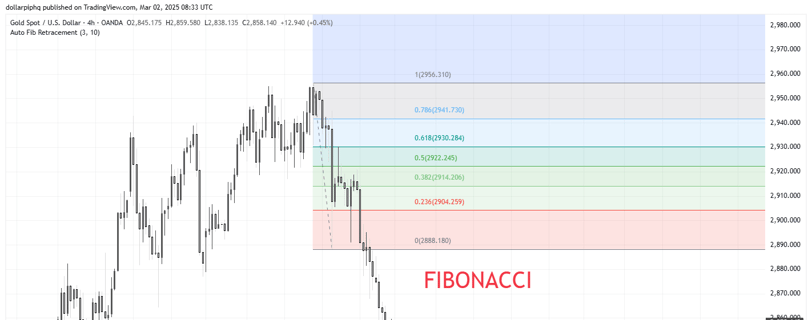
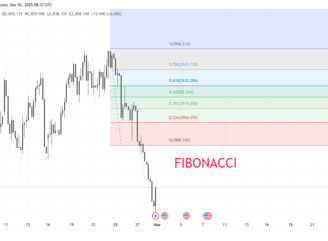
5. Fibonacci Retracement
Fibonacci Retracement is used to identify support and resistance levels based on Fibonacci ratios (23.6%, 38.2%, 50%, 61.8%, and 78.6%). Traders use these levels to find potential price reversal areas within a major trend.
When the price pulls back from the main trend, Fibonacci levels help determine where the price might bounce back.
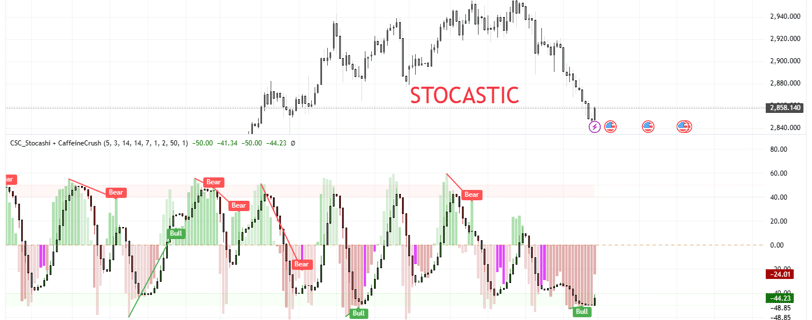
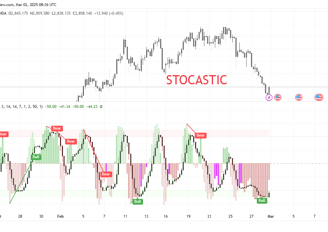
6. Stochastic Oscillator
The Stochastic Oscillator is a momentum indicator that compares the closing price to the price range over a certain period. This indicator ranges from 0 to 100:
Above 80: Overbought (potential bearish reversal).
Below 20: Oversold (potential bullish reversal).
Stochastic also identifies divergence and crossover signals between %K and %D lines to determine market momentum. Choosing the right technical indicators depends on your trading style. Many traders combine multiple indicators to enhance their analysis accuracy. Moving Average, RSI, Bollinger Bands, MACD, Fibonacci Retracement, and Stochastic Oscillator are six widely used indicators for effective forex market analysis.
Use these indicators with the right strategy to increase your chances of success in forex trading!